Welcome to plottable’s documentation!
Contents
Welcome to plottable’s documentation!#
Beautiful Tables in Matplotlib#
plottable is a Python library for plotting beautiful, presentation ready tables in Matplotlib.
Quick start#
Installation#
pip install plottable
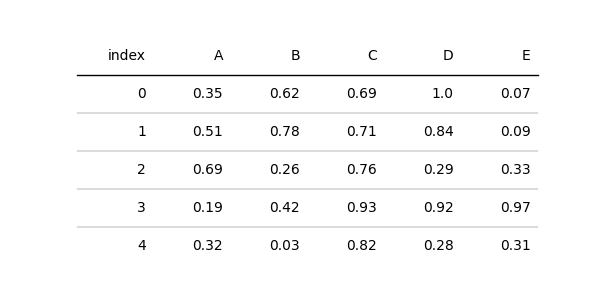
A Basic Example#
import matplotlib.pyplot as plt
import numpy as np
import pandas as pd

from plottable import Table

d = pd.DataFrame(np.random.random((10, 5)), columns=["A", "B", "C", "D", "E"]).round(2)
fig, ax = plt.subplots(figsize=(5, 8))
tab = Table(d)

plt.show()
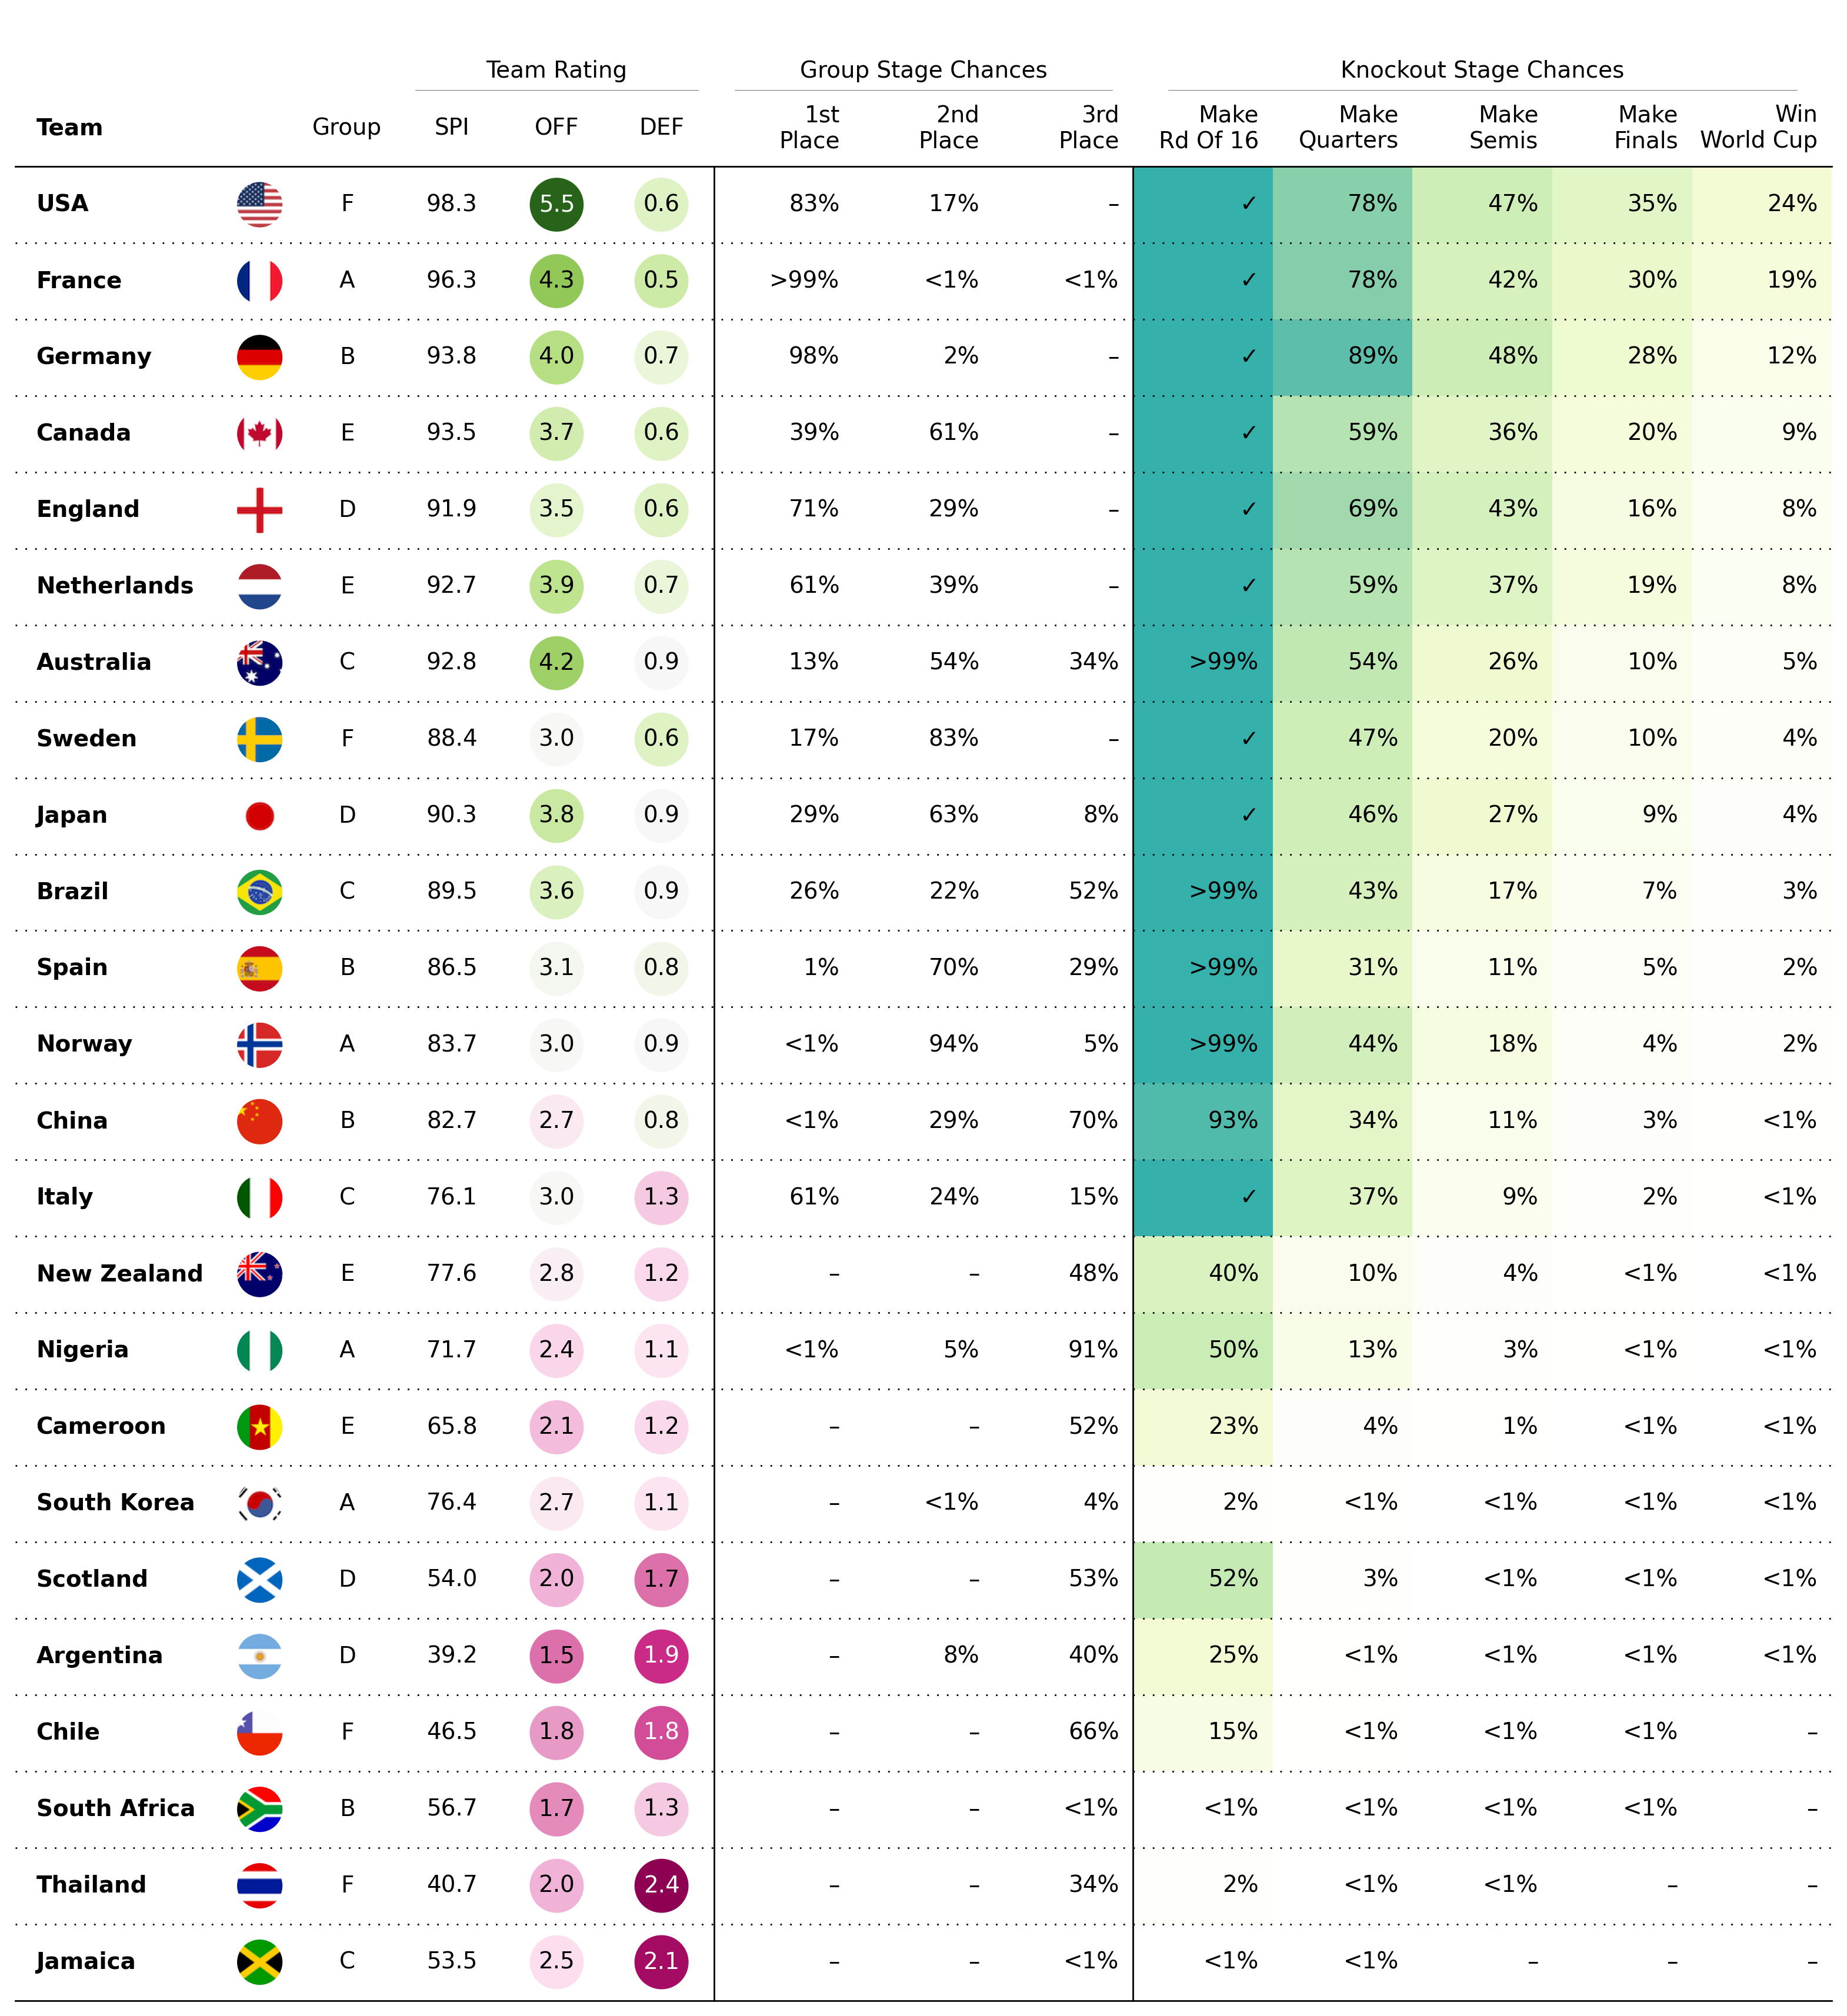
Women’s World Cup Example#
You can access the WWC Example Notebook here
Customizing a Table#
Contributing#
Contributors are very welcome to this project.
Please take a look at the Contributor Guide
Credits#
plottable is built for the lack of good table packages in the python ecosystem. It draws inspiration from R packages gt and reactable, from blog posts about creating tables in matplotlib Tim Bayer: How to create custom tables and Son of a corner: Beautiful Tables in Matplotlib, a Tutorial and from matplotlibs own table module.
Documentation:
Example Notebooks:
Development: