Bohndesliga Table Style
Contents
Bohndesliga Table Style#
Bohndesliga is a german online broadbast by Rocket Beans TV. In their show they discuss the recent games of the Bundesliga (in german). They have created a nice visual style to show the Bundesliga table that we are going to recreate with plottable (with a few details adjusted).
You can view an example of the table we are going to recreate at this timestamped video.
Imports#
%load_ext autoreload
%autoreload 2

from pathlib import Path

import matplotlib.pyplot as plt
import numpy as np
import pandas as pd

from plottable import ColDef, Table
from plottable.plots import image
Getting the data#
FIVETHIRTYEIGHT_URLS = {
    "SPI_MATCHES": "https://projects.fivethirtyeight.com/soccer-api/club/spi_matches.csv",
    "SPI_MATCHES_LATEST": "https://projects.fivethirtyeight.com/soccer-api/club/spi_matches_latest.csv",
}

df = pd.read_csv(FIVETHIRTYEIGHT_URLS["SPI_MATCHES_LATEST"])
bl = df.loc[df.league == "German Bundesliga"].dropna()
Data Processing#
def add_points(df: pd.DataFrame) -> pd.DataFrame:
    df["pts_home"] = np.where(
        df["score1"] > df["score2"], 3, np.where(df["score1"] == df["score2"], 1, 0)
    )
    df["pts_away"] = np.where(
        df["score1"] < df["score2"], 3, np.where(df["score1"] == df["score2"], 1, 0)
    )

    return df


def get_wins_draws_losses(games: pd.DataFrame) -> pd.DataFrame:
    return (
        games.rename({"pts_home": "pts", "team1": "team"}, axis=1)
        .groupby("team")["pts"]
        .value_counts()
        .add(
            games.rename({"pts_away": "pts", "team2": "team"}, axis=1)
            .groupby("team")["pts"]
            .value_counts(),
            fill_value=0,
        )
        .astype(int)
        .rename("count")
        .reset_index(level=1)
        .pivot(columns="pts", values="count")
        .rename({0: "L", 1: "D", 3: "W"}, axis=1)[["W", "D", "L"]]
    )
bl = add_points(bl)
perform = (
    bl.groupby("team1")[[
        "pts_home",
        "score1",
        "score2",
        "xg1",
        "xg2",
    ]]
    .sum()
    .set_axis(
        [
            "pts",
            "gf",
            "ga",
            "xgf",
            "xga",
        ],
        axis=1,
    )
    .add(
        bl.groupby("team2")[[
            "pts_away",
            "score2",
            "score1",
            "xg2",
            "xg1",
        ]]
        .sum()
        .set_axis(
            [
                "pts",
                "gf",
                "ga",
                "xgf",
                "xga",
            ],
            axis=1,
        )
    )
)

perform.index.name = "team"

perform["gd"] = perform["gf"] - perform["ga"]

perform = perform[
    [
        "pts",
        "gd",
        "gf",
        "ga",
        "xgf",
        "xga",
    ]
]

perform["games"] = bl.groupby("team1").size().add(bl.groupby("team2").size())
wins_draws_losses = get_wins_draws_losses(bl)
perform = pd.concat([perform, wins_draws_losses], axis=1)
perform
| pts | gd | gf | ga | xgf | xga | games | W | D | L | |
|---|---|---|---|---|---|---|---|---|---|---|
| team | ||||||||||
| 1. FC Union Berlin | 27 | 7.0 | 23.0 | 16.0 | 13.85 | 14.29 | 14 | 8 | 3 | 3 |
| Bayer Leverkusen | 18 | -1.0 | 25.0 | 26.0 | 22.98 | 23.41 | 15 | 5 | 3 | 7 |
| Bayern Munich | 34 | 36.0 | 49.0 | 13.0 | 41.06 | 16.55 | 15 | 10 | 4 | 1 |
| Borussia Dortmund | 25 | 4.0 | 25.0 | 21.0 | 26.56 | 18.72 | 15 | 8 | 1 | 6 |
| Borussia Monchengladbach | 22 | 4.0 | 28.0 | 24.0 | 24.62 | 26.00 | 15 | 6 | 4 | 5 |
| Eintracht Frankfurt | 26 | 8.0 | 31.0 | 23.0 | 24.69 | 18.11 | 14 | 8 | 2 | 4 |
| FC Augsburg | 15 | -8.0 | 18.0 | 26.0 | 16.93 | 31.46 | 15 | 4 | 3 | 8 |
| FC Cologne | 17 | -8.0 | 21.0 | 29.0 | 23.79 | 20.35 | 15 | 4 | 5 | 6 |
| Hertha Berlin | 14 | -3.0 | 19.0 | 22.0 | 20.45 | 24.78 | 15 | 3 | 5 | 7 |
| Mainz | 18 | -5.0 | 18.0 | 23.0 | 18.62 | 22.58 | 14 | 5 | 3 | 6 |
| RB Leipzig | 28 | 9.0 | 30.0 | 21.0 | 30.96 | 17.72 | 15 | 8 | 4 | 3 |
| SC Freiburg | 27 | 5.0 | 21.0 | 16.0 | 24.65 | 18.82 | 14 | 8 | 3 | 3 |
| Schalke 04 | 9 | -19.0 | 13.0 | 32.0 | 18.39 | 26.38 | 15 | 2 | 3 | 10 |
| TSG Hoffenheim | 18 | 0.0 | 22.0 | 22.0 | 24.01 | 23.31 | 15 | 5 | 3 | 7 |
| VfB Stuttgart | 14 | -9.0 | 18.0 | 27.0 | 21.88 | 22.20 | 15 | 3 | 5 | 7 |
| VfL Bochum | 13 | -22.0 | 14.0 | 36.0 | 15.39 | 34.90 | 15 | 4 | 1 | 10 |
| VfL Wolfsburg | 23 | 4.0 | 24.0 | 20.0 | 20.12 | 24.34 | 15 | 6 | 5 | 4 |
| Werder Bremen | 21 | -2.0 | 25.0 | 27.0 | 22.15 | 27.18 | 15 | 6 | 3 | 6 |
# mapping teamnames to logo paths

club_logo_path = Path("bundesliga_crests_22_23")
club_logo_files = list(club_logo_path.glob("*.png"))
club_logos_paths = {f.stem: f for f in club_logo_files}
perform = perform.reset_index()

# Add a column for crests
perform.insert(0, "crest", perform["team"])
perform["crest"] = perform["crest"].replace(club_logos_paths)

# sort by table standings
perform = perform.sort_values(by=["pts", "gd", "gf"], ascending=False)

for colname in ["gd", "gf", "ga"]:
    perform[colname] = perform[colname].astype("int32")

perform["goal_difference"] = perform["gf"].astype(str) + ":" + perform["ga"].astype(str)

perform["rank"] = list(range(1, 19))
Building the Bohndesliga Table#
row_colors = {
    "top4": "#2d3636",
    "top6": "#516362",
    "playoffs": "#8d9386",
    "relegation": "#c8ab8d",
    "even": "#627979",
    "odd": "#68817e",
}

bg_color = row_colors["odd"]
text_color = "#e0e8df"

table_cols = ["crest", "team", "games", "W", "D", "L", "goal_difference", "gd", "pts"]
perform[table_cols]
| crest | team | games | W | D | L | goal_difference | gd | pts | |
|---|---|---|---|---|---|---|---|---|---|
| 2 | bundesliga_crests_22_23/Bayern Munich.png | Bayern Munich | 15 | 10 | 4 | 1 | 49:13 | 36 | 34 |
| 10 | bundesliga_crests_22_23/RB Leipzig.png | RB Leipzig | 15 | 8 | 4 | 3 | 30:21 | 9 | 28 |
| 0 | bundesliga_crests_22_23/1. FC Union Berlin.png | 1. FC Union Berlin | 14 | 8 | 3 | 3 | 23:16 | 7 | 27 |
| 11 | bundesliga_crests_22_23/SC Freiburg.png | SC Freiburg | 14 | 8 | 3 | 3 | 21:16 | 5 | 27 |
| 5 | bundesliga_crests_22_23/Eintracht Frankfurt.png | Eintracht Frankfurt | 14 | 8 | 2 | 4 | 31:23 | 8 | 26 |
| 3 | bundesliga_crests_22_23/Borussia Dortmund.png | Borussia Dortmund | 15 | 8 | 1 | 6 | 25:21 | 4 | 25 |
| 16 | bundesliga_crests_22_23/VfL Wolfsburg.png | VfL Wolfsburg | 15 | 6 | 5 | 4 | 24:20 | 4 | 23 |
| 4 | bundesliga_crests_22_23/Borussia Monchengladba... | Borussia Monchengladbach | 15 | 6 | 4 | 5 | 28:24 | 4 | 22 |
| 17 | bundesliga_crests_22_23/Werder Bremen.png | Werder Bremen | 15 | 6 | 3 | 6 | 25:27 | -2 | 21 |
| 13 | bundesliga_crests_22_23/TSG Hoffenheim.png | TSG Hoffenheim | 15 | 5 | 3 | 7 | 22:22 | 0 | 18 |
| 1 | bundesliga_crests_22_23/Bayer Leverkusen.png | Bayer Leverkusen | 15 | 5 | 3 | 7 | 25:26 | -1 | 18 |
| 9 | bundesliga_crests_22_23/Mainz.png | Mainz | 14 | 5 | 3 | 6 | 18:23 | -5 | 18 |
| 7 | bundesliga_crests_22_23/FC Cologne.png | FC Cologne | 15 | 4 | 5 | 6 | 21:29 | -8 | 17 |
| 6 | bundesliga_crests_22_23/FC Augsburg.png | FC Augsburg | 15 | 4 | 3 | 8 | 18:26 | -8 | 15 |
| 8 | bundesliga_crests_22_23/Hertha Berlin.png | Hertha Berlin | 15 | 3 | 5 | 7 | 19:22 | -3 | 14 |
| 14 | bundesliga_crests_22_23/VfB Stuttgart.png | VfB Stuttgart | 15 | 3 | 5 | 7 | 18:27 | -9 | 14 |
| 15 | bundesliga_crests_22_23/VfL Bochum.png | VfL Bochum | 15 | 4 | 1 | 10 | 14:36 | -22 | 13 |
| 12 | bundesliga_crests_22_23/Schalke 04.png | Schalke 04 | 15 | 2 | 3 | 10 | 13:32 | -19 | 9 |
Setting up the ColumnDefinitions#
With the ColumnDefinitions we we can adjust the tables style by supplying keywords such as title, width, formatters and textprops.
See also
You can view more details in the Using ColumnDefinition Notebook.
table_col_defs = [
    ColDef("rank", width=0.5, title=""),
    ColDef("crest", width=0.35, plot_fn=image, title=""),
    ColDef("team", width=2.5, title="", textprops={"ha": "left"}),
    ColDef("games", width=0.5, title="Games"),
    ColDef("W", width=0.5),
    ColDef("D", width=0.5),
    ColDef("L", width=0.5),
    ColDef("goal_difference", title="Goals"),
    ColDef("gd", width=0.5, title="", formatter="{:+}"),
    ColDef("pts", border="left", title="Points"),
]
Plotting the Table#
See also
Here we use various keywords of Table to control its appearance. You can view more details in the Styling a Table Notebook.
fig, ax = plt.subplots(figsize=(14, 12))

plt.rcParams["text.color"] = text_color
plt.rcParams["font.family"] = "Roboto"

fig.set_facecolor(bg_color)
ax.set_facecolor(bg_color)

table = Table(
    perform,
    column_definitions=table_col_defs,
    row_dividers=True,
    col_label_divider=False,
    footer_divider=True,
    index_col="rank",
    columns=table_cols,
    even_row_color=row_colors["even"],
    footer_divider_kw={"color": bg_color, "lw": 2},
    row_divider_kw={"color": bg_color, "lw": 2},
    column_border_kw={"color": bg_color, "lw": 2},
    textprops={"fontsize": 16, "ha": "center", "fontname": "Roboto"},
)

for idx in [0, 1, 2, 3]:
    table.rows[idx].set_facecolor(row_colors["top4"])

for idx in [4, 5]:
    table.rows[idx].set_facecolor(row_colors["top6"])

table.rows[15].set_facecolor(row_colors["playoffs"])

for idx in [16, 17]:
    table.rows[idx].set_facecolor(row_colors["relegation"])
    table.rows[idx].set_fontcolor(row_colors["top4"])


fig.savefig(
    "images/bohndesliga_table_recreation.png",
    facecolor=fig.get_facecolor(),
    dpi=200,
)
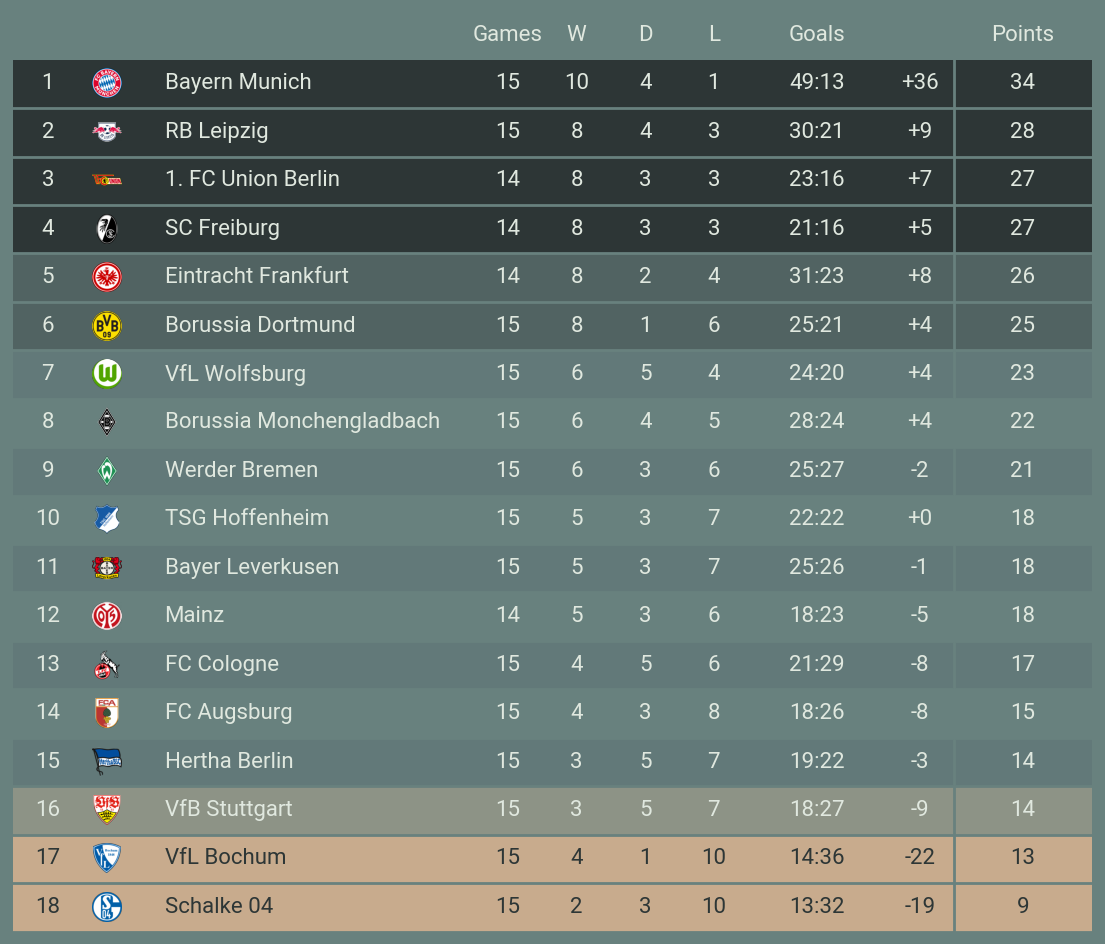
Note on the slightly adjusted details:
I chose to make the light text a little lighter than the original and used the background color of the top4 rows as the fontcolor for the bottom two rows because I think the higher contrast makes it a little bit easier to read.
I also chose to stick to the light text on the background for the header row to keep this consistent.
Finally I added a little clarity by adding titles to the points and goal difference columns. This also allowed me to not highlight the points additionally with a bold weight.