Using Text Formatters
Contents
Using Text Formatters#
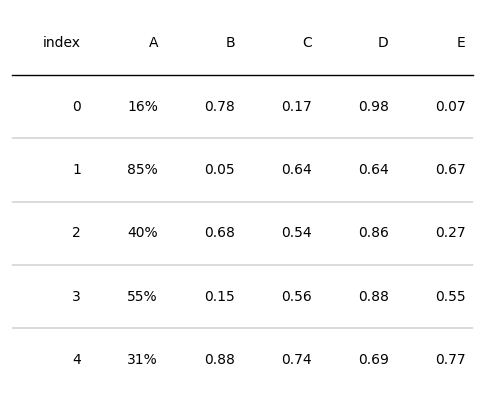
You can provide a function that takes a cells value as input and outputs a string to be displayed on the table.
Some basic formatters are provided in plottable.formatters.
import matplotlib.pyplot as plt
import numpy as np
import pandas as pd

from plottable import Table

from plottable import ColDef
from plottable.formatters import decimal_to_percent

d = pd.DataFrame(np.random.random((5, 5)), columns=["A", "B", "C", "D", "E"]).round(2)
fig, ax = plt.subplots(figsize=(6, 5))
tab = Table(d, column_definitions=[ColDef(name="A", formatter=decimal_to_percent)])

plt.show()
Available formatters are:
def decimal_to_percent(val: float) -> str: ...
    """Formats Numbers to a string, replacing
        0 with "–"
        1 with "✓"
        values < 0.01 with "<1%" and
        values > 0.99 with ">99%"
    """


def tickcross(val: Number | bool) -> str: ...
    """formats a bool or (0, 1) value to a tick "✔" or cross "✖"."""


def signed_integer(val: int) -> str: ...
    """formats an integer to a string that includes the sign, ie. 1 to "+1"."""
See also
The Women’s World Cup Example makes use of the decimal_to_percent formatter.
Creating your own formatters#
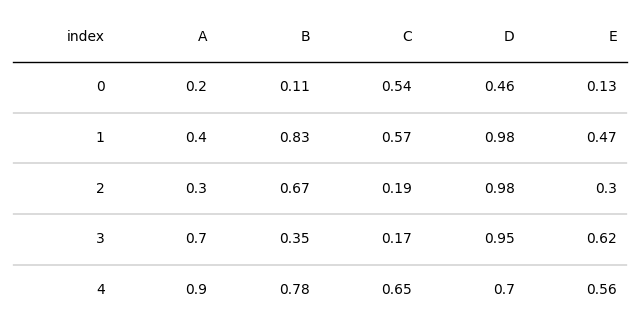
It is very easy to create your own formatter functions.
Let’s take an easy example of rounding of values, for which we will use a lambda function:
lambda x: round(x, 2)
You can also create more complex functions like the decimal_to_percent function above.
def my_formatter(cell_content: Any) -> str | Number: ...
If you create any formatters that others would enjoy using, please consider sharing them by creating a Pull Request!
d = pd.DataFrame(np.random.random((5, 5)), columns=["A", "B", "C", "D", "E"]).round(2)
fig, ax = plt.subplots(figsize=(8, 4))
tab = Table(d, column_definitions=[ColDef(name="A", formatter=lambda x: round(x, 1))])

plt.show()
Builtin String Formatters#
To perform common string formatting tasks, the best option is to use builtin formatter syntax.
Formatting digits reference source: https://www.pythoncheatsheet.org/cheatsheet/string-formatting
number      format      output      description
------      ------      ------      -----------
3.1415926   {:.2f}      3.14        Format float 2 decimal places
3.1415926   {:+.2f}     +3.14       Format float 2 decimal places with sign
-1          {:+.2f}     -1.00       Format float 2 decimal places with sign
2.71828     {:.0f}      3           Format float with no decimal places
4           {:0>2d}     04          Pad number with zeros (left padding, width 2)
4           {:x<4d}     4xxx        Pad number with x’s (right padding, width 4)
10          {:x<4d}     10xx	    Pad number with x’s (right padding, width 4)
1000000     {:,}        1,000,000   Number format with comma separator
0.35        {:.2%}      35.00%      Format percentage
1000000000  {:.2e}      1.00e+09    Exponent notation
11          {:11d}      11          Right-aligned (default, width 10)
11          {:<11d}     11          Left-aligned (width 10)
11          {:^11d}     11          Center aligned (width 10)
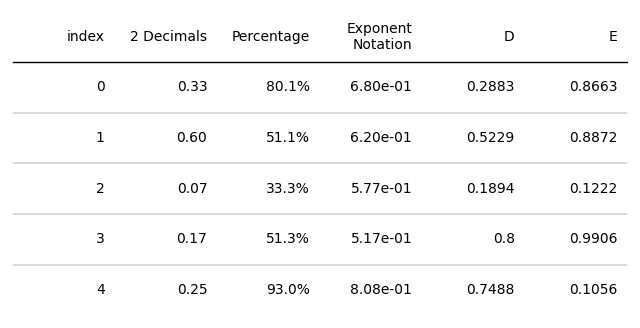
You can provide the format string to a ColumnDefinitions formatter argument just as a Callable:
d = pd.DataFrame(np.random.random((5, 5)), columns=["A", "B", "C", "D", "E"]).round(4)
fig, ax = plt.subplots(figsize=(8, 4))
tab = Table(d, column_definitions=[ColDef(name="A", title="2 Decimals", formatter="{:.2f}"),
                                   ColDef(name="B", title="Percentage", formatter="{:.1%}"),
                                   ColDef(name="C", title="Exponent\nNotation", formatter="{:.2e}")])

plt.show()